Tech isn't just leading the market.
It's dominating it.
$QQQM ( ▲ 1.0% ) sits right at the center of that trade.
The fund closed October with $63.39 billion in net assets.
Year-to-date returns hit 20.14%.
That's roughly 500 basis points ahead of the S&P 500 over the same stretch.
The gap comes down to one thing: concentrated exposure to the names that actually move markets.
What You're Getting
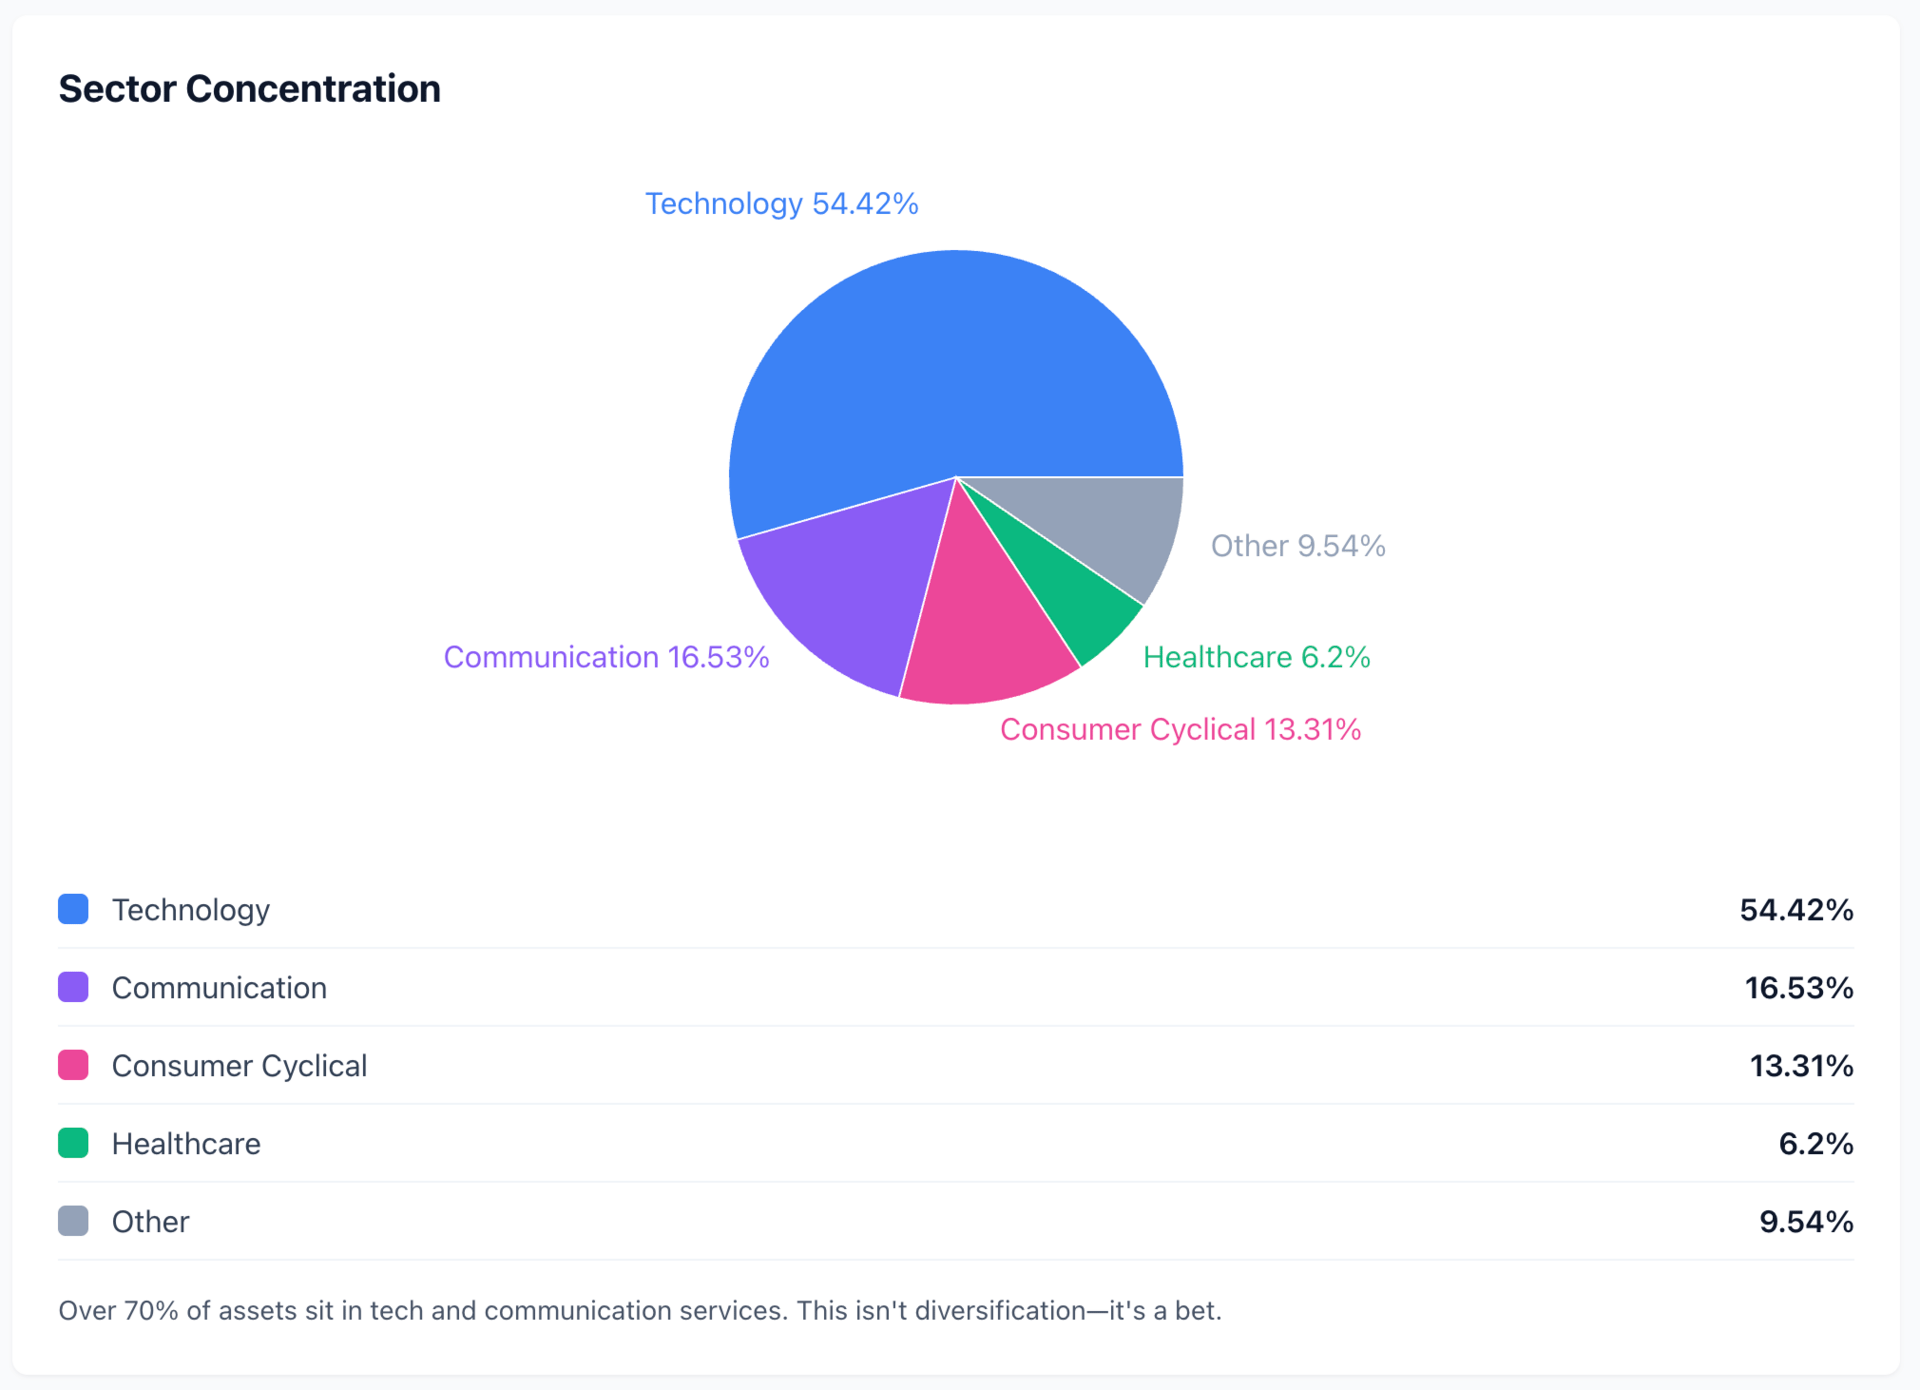
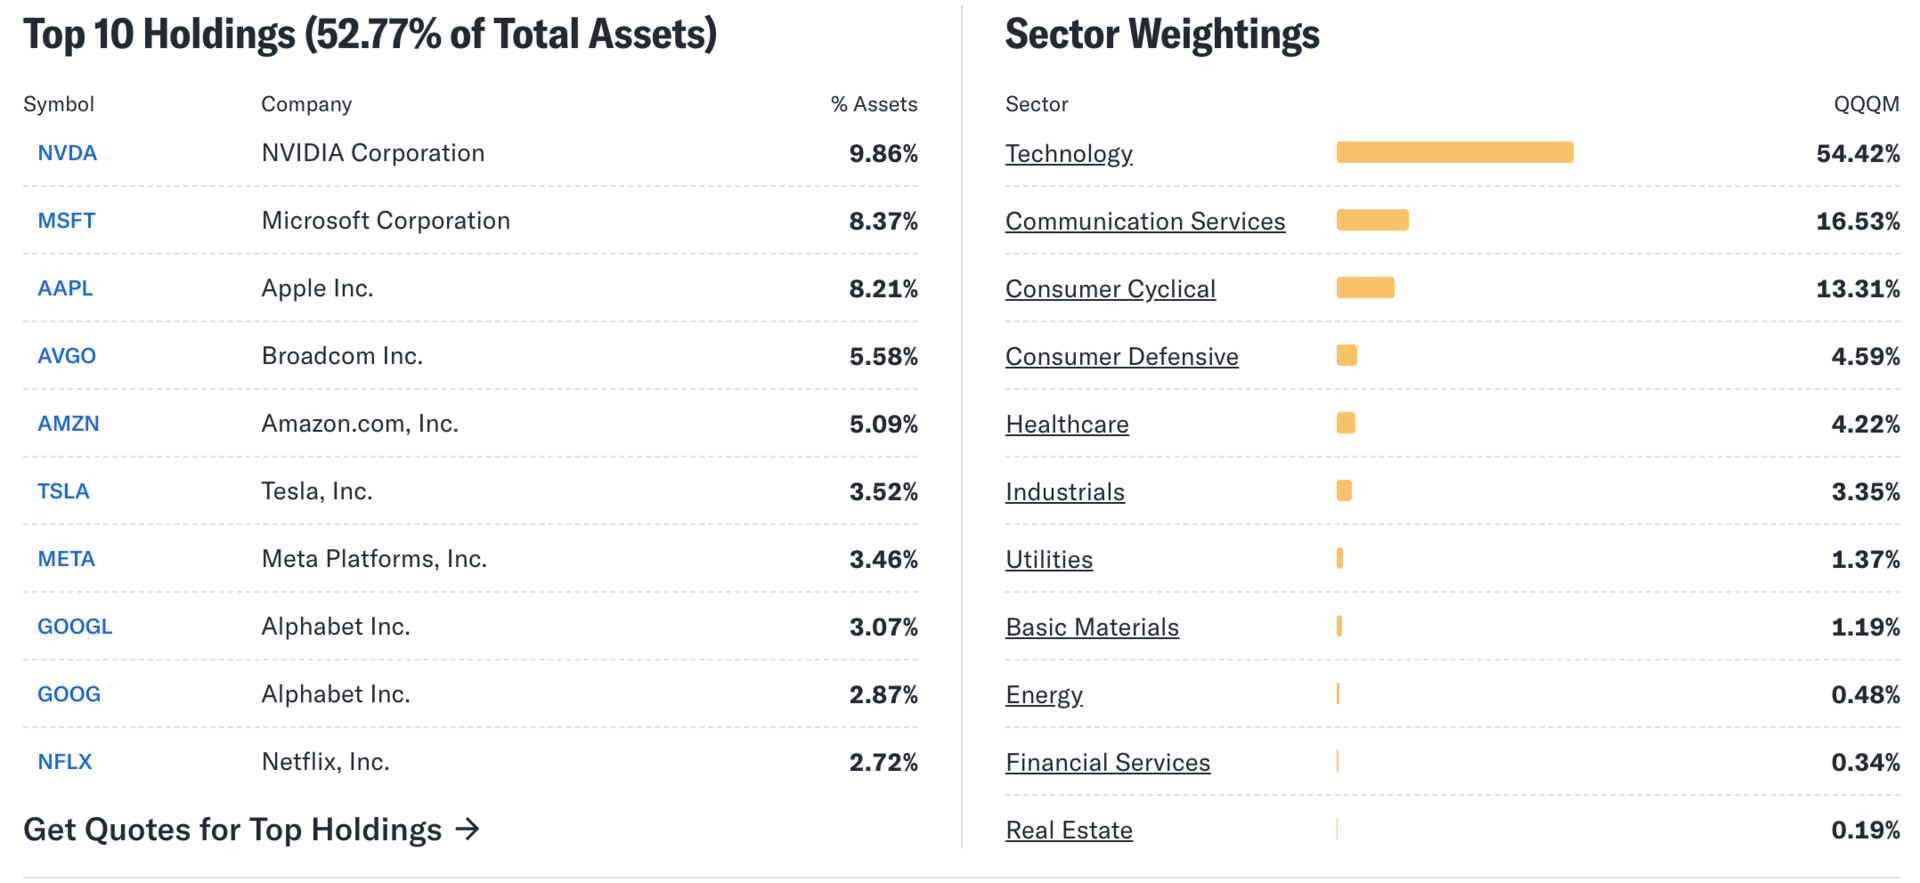
Technology represents 54.42% of the portfolio.
Communication Services adds another 16.53%.
Consumer Cyclical rounds out the top three at 13.31%.
That's not diversification. That's a thesis.
You're betting on mega-cap tech leadership, AI infrastructure spending, and the handful of companies with the balance sheets to fund it.
The expense ratio sits at 0.15%. For context, that's materially cheaper than legacy alternatives tracking the same Nasdaq-100 Index.
Over ten years, that cost different compounds.
For buy-and-hold investors, it matters.
The Numbers That Matter
YTD Return: 20.14%
Net Assets: $63.39B
P/E Ratio: 35.85
Yield: 0.50%
The fund carries a beta of 1.10.
In other words, when markets move, $QQQM ( ▲ 1.0% ) moves 10% more. Both directions.
That volatility profile is the trade-off for concentration in high-growth names.
What Analysts See
Wall Street's consensus on the underlying holdings shows 90 buy ratings, 13 holds, and zero sells.
Average price targets suggest 8.94% upside from current levels.
Those figures reflect analyst views on companies like Apple $AAPL, Microsoft $MSFT, and Nvidia $NVDA rather than the ETF wrapper itself. But they signal where the smart money thinks tech is headed.
Todd Rosenbluth at VettaFi points to the structural advantages: "Lower-cost alternatives to established products gain traction when performance matches and fees drop meaningfully. QQQM delivers both."
Investors need to understand they're making a sector bet. When tech leads, this positioning pays off. When it doesn't, the concentration hurts.
How It Works in Practice
The fund tracks 102 holdings. Not 500. Not 1,000.
Just over 100 names. That narrow focus means individual company performance shows up directly in your returns.
Nvidia $NVDA ( ▼ 0.1% ) has a strong quarter? You feel it.
Apple $AAPL ( ▲ 0.13% ) delivers strong iPhone sales? You feel that too.
Technical indicators across multiple timeframes flash buy signals, though some shorter-term measures show consolidation near recent highs.
That mixed picture makes sense given the run tech has had this year.
What to Watch
AI infrastructure spending drives the current narrative.
Capital expenditure from hyperscalers, Amazon $AMZN ( ▲ 0.44% ) and Alphabet $GOOGL ( ▲ 0.96% ) building data centers, matters more to $QQQM ( ▲ 1.0% ) performance than broader economic indicators.
Semiconductor demand cycles matter.
Regulatory developments affecting large-cap tech matter.
These aren't traditional economic catalysts.
They're sector-specific forces that move mega-cap tech independently of broader market trends.
The Real Question
Do you believe tech leadership continues?
If yes, $QQQM offers concentrated exposure at a competitive cost.
If you're uncertain, concentration works against you.
There's no middle ground here.
The $15.3 billion in inflows this year suggests plenty of investors have made their choice.
Now you need to make yours.
What's catching investor attention today: Microsoft's 40% Azure Growth vs. Alphabet's $100B Milestone: Which Tech Giant Is Winning?
Disclaimer: This is not financial or investment advice. Do your own research and consult a qualified financial advisor before investing.


